
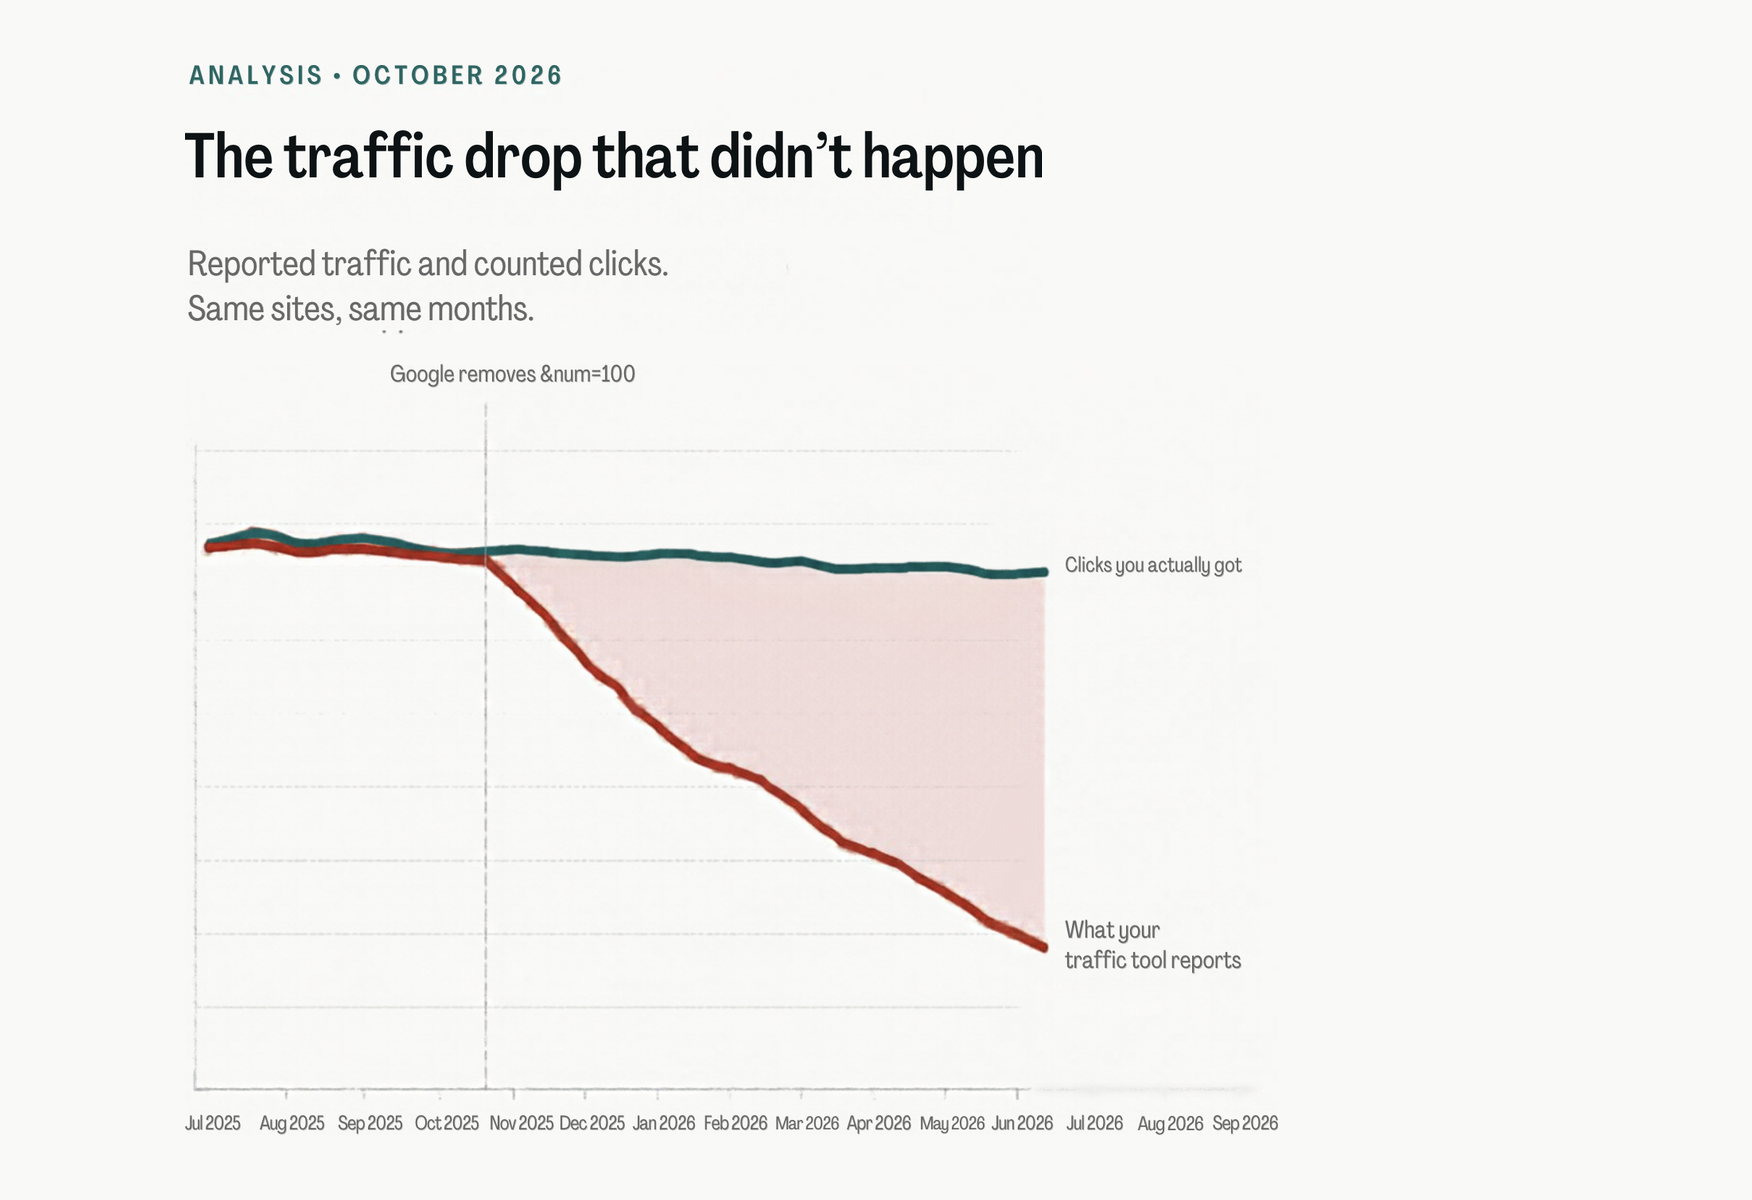
One client's Ahrefs graph showed organic traffic down 44 percent year on year. Their Search Console showed clicks up 286 percent over exactly the same quarter.
That is not a rounding error, so we checked it properly. We pulled the Search Console properties we manage, aggregated them to one figure per business, and compared counted clicks against Ahrefs estimated organic traffic for the same domain over the same months. Sites too small to read a percentage from were excluded.
The finding is not that Ahrefs is too pessimistic, although it usually is. The finding is that it is unreliable at the level of an individual site, which is the only level anyone makes decisions at.
The result
July to September 2025 against July to September 2026. Like for like, three months each side.
| Measure | Finding |
|---|---|
| Median change, counted Search Console clicks | −11.2% |
| Median change, Ahrefs estimated traffic | −36.5% |
| Median absolute gap between the two | 29.3 points |
| Sites where Ahrefs landed within 10 points of reality | 22% |
| Sites where Ahrefs got the direction of travel wrong | 28% |
| Sites where the gap was 20 points or more | 63% |
| Sites where Ahrefs was more pessimistic than reality | 81% |
| Correlation between the two measures | r = 0.52 |
Clicks really are down. The median site lost 11 percent of its organic clicks year on year, and nothing here should be read as reassurance that 2026 was a good year for ecommerce search.
The measurement is a separate problem. Ahrefs put that same median at a 37 percent fall, more than three times the real figure. It matched reality closely on roughly one site in five. The typical error was not a few points, it was 29.
We ran the same comparison on a single month before widening it to a quarter. The headline numbers barely moved: the median gap went from 29.4 points to 29.3, and the share of sites with the direction wrong from 31 percent to 28. A gap that survives both windows is not one month of noise.
It is wrong in both directions
Twenty-eight percent of sites moved one way in counted clicks and the other way in Ahrefs. Most of those are Ahrefs missing growth.
| Store | Search Console | Ahrefs | Gap |
|---|---|---|---|
| Candle and homeware brand | +286% | −44% | 330 points |
| Skincare brand | +89% | −57% | 146 points |
| Art print studio | +103% | −17% | 120 points |
| Jewellery brand | +95% | −20% | 115 points |
Around two in five of the sites grew their clicks over the quarter. Two thirds of those appear to be in decline in Ahrefs.
A smaller group fails the other way, and these matter more, because they show the problem is noise and not a bias you could correct for.
| Store | Search Console | Ahrefs | Gap |
|---|---|---|---|
| Personalised gifts retailer | −22% | +49% | 71 points |
| Sauna and wellness | +30% | +98% | 68 points |
| Car buying service | +11% | +75% | 63 points |
If the error were reliably pessimistic you could apply a mental discount to every graph you see. You cannot. A business quietly losing a fifth of its clicks can appear to be up by half.
You can check this one yourself
The comparison above relies on Search Console access nobody else has. So here is the same question asked entirely with public data, which anyone with an Ahrefs seat can reproduce.
We took six Australian retail categories, seeded from live SERPs and completed with the obvious majors, and ran the identical three-month comparison on each.
Electronics and appliances
| Brand | Change |
|---|---|
| Umart | -41% |
| JB Hi-Fi | -40% |
| Officeworks | -40% |
| Scorptec | -39% |
| Appliances Online | -33% |
| Kogan | -29% |
| Harvey Norman | -28% |
| Mwave | -25% |
| The Good Guys | -24% |
| Bing Lee | -23% |
Furniture and homewares
| Brand | Change |
|---|---|
| Brosa | -74% |
| Amart Furniture | -58% |
| Nick Scali | -48% |
| King Living | -44% |
| Freedom | -39% |
| Temple & Webster | -38% |
| Adairs | -36% |
| Pillow Talk | -34% |
| Fantastic Furniture | -33% |
| Bed Bath N' Table | -28% |
Tools and hardware
| Brand | Change |
|---|---|
| Toolmart | -51% |
| TradeTools | -43% |
| Bunnings | -41% |
| Total Tools | -39% |
| Mitre 10 | -34% |
| Sydney Tools | -27% |
| Toolkit Depot | -18% |
Pet
| Brand | Change |
|---|---|
| Pet Circle | -37% |
| PETstock | -30% |
| Budget Pet Products | -30% |
| Kazoo | -30% |
| Petbarn | -29% |
| VetSupply | -13% |
Running and sportswear
| Brand | Change |
|---|---|
| runnersshop.com.au | -60% |
| theiconic.com.au | -56% |
| sportsmart.com.au | -56% |
| brooksrunning.com.au | -50% |
| nike.com | -45% |
| platypusshoes.com.au | -43% |
| asics.com | -43% |
| hypedc.com | -39% |
| footlocker.com.au | -38% |
| puma.com | -35% |
Beauty and pharmacy
| Brand | Change |
|---|---|
| Beauty Bay | -77% |
| Amcal | -52% |
| Myer | -49% |
| Aesop | -44% |
| Adore Beauty | -41% |
| Hairhouse | -39% |
| TerryWhite Chemmart | -26% |
| Oz Hair & Beauty | -26% |
| David Jones | -26% |
| Sephora | -25% |
Across the six categories, 72 of 74 well-known brands show a decline, with a median of −33%. The two exceptions are the smallest sites in the set.
| Category | Brands | Median | Declined |
|---|---|---|---|
| Running and sportswear | 21 | −34% | 21 of 21 |
| Furniture and homewares | 12 | −37% | 12 of 12 |
| Electronics and appliances | 11 | −30% | 11 of 11 |
| Tools and hardware | 7 | −39% | 7 of 7 |
| Pet | 6 | −30% | 6 of 6 |
| Beauty and pharmacy | 17 | −26% | 15 of 17 |
Stop and consider what that would mean if it were real. Search is close to zero-sum at the top of a results page. If Bunnings loses 41 percent of its organic traffic, that demand does not evaporate, it moves to Mitre 10 or Total Tools. For every competitor in a category to lose a third at the same time, with nobody gaining a point of share, is not a market event. No category behaves that way, and six of them do not behave that way simultaneously.
At this point the explanation has to be something that happens to every website at once, on the same schedule, regardless of what any of them did.
Why this happened
On 8 September 2025, Google quietly removed the &num=100 parameter.
For fifteen years that parameter let a tool fetch 100 search results in a single request. Every rank tracker in the market was built on it. Once it was gone, seeing the same depth meant ten requests instead of one, so tracking anything past the first page or two became roughly ten times more expensive overnight.
The tools made the only commercial decision available: they stopped looking that deep. Keywords sitting at position 20, 40, 70 did not move. They simply stopped being checked, and a keyword that cannot be verified is reported as lost.
This is where the traffic number comes apart. Estimated traffic is not measured. It is calculated, by taking every keyword a tool can see, applying an expected click-through rate for that position, and adding it all up. Remove tens of thousands of keywords from that sum and the total falls, even though the website did not change and the rankings did not move.
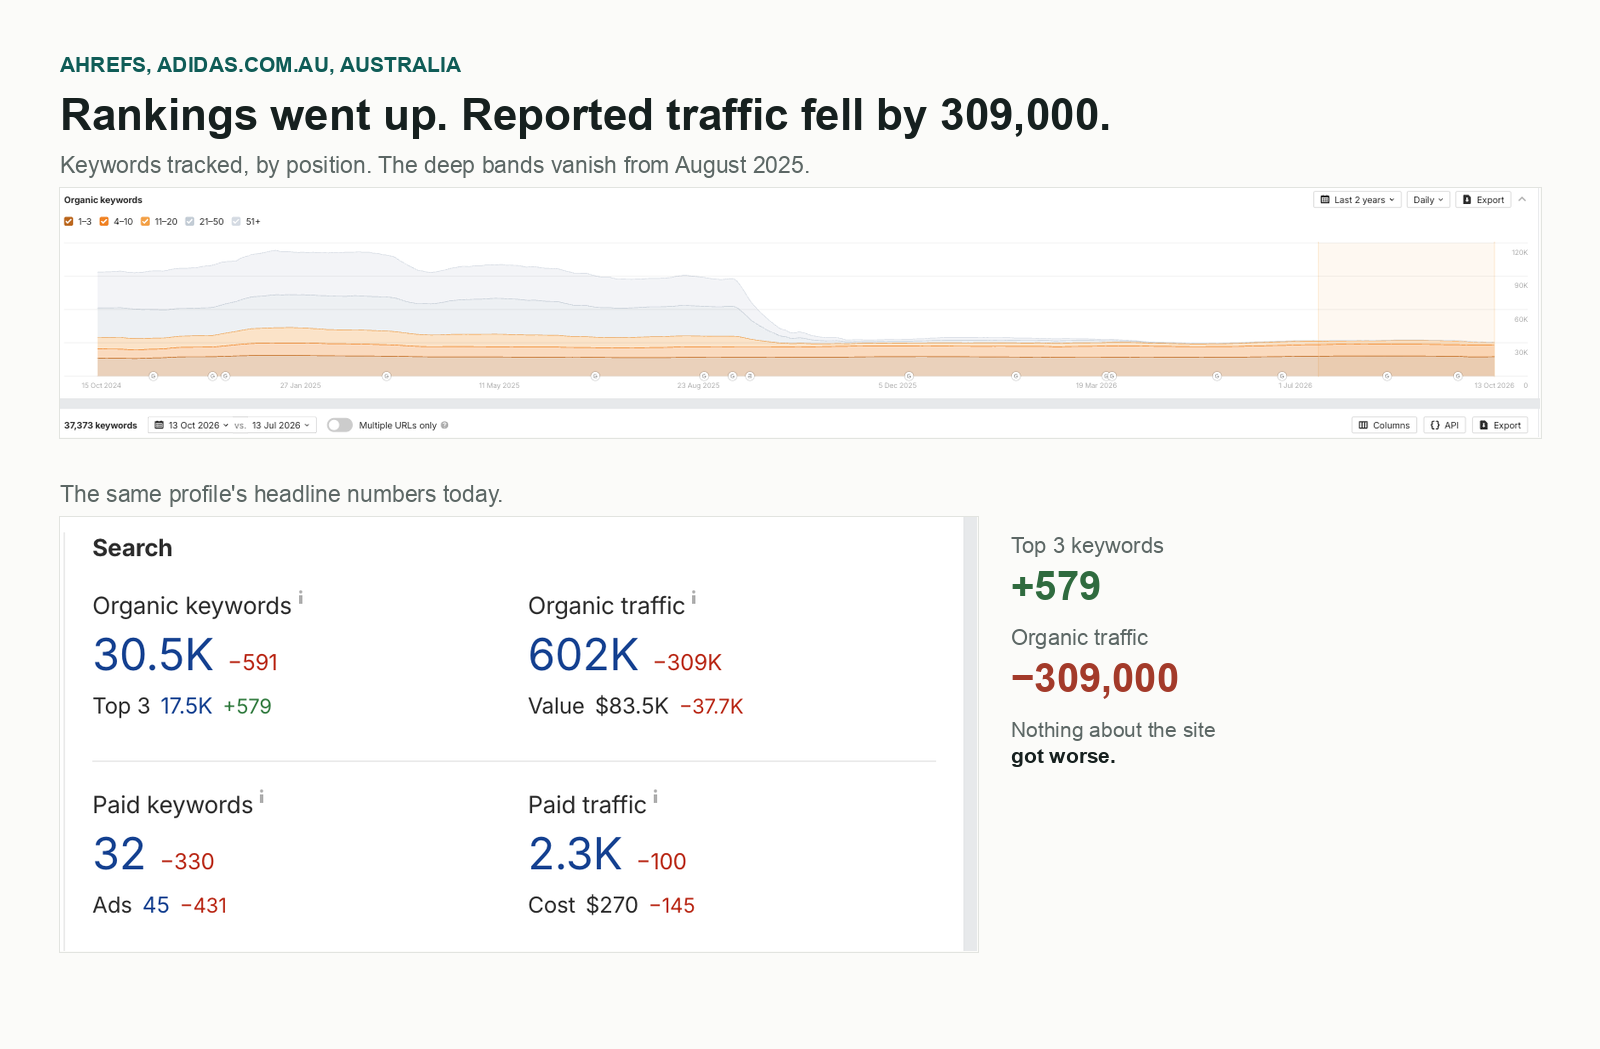
adidas Australia is the clearest example we found. Its top-three keyword count is up 579. Its reported organic traffic is down 309,000. Both numbers sit in the same panel of the same profile on the same day.
Underneath, the pattern is identical across every brand we checked.
| adidas.com.au, Sep 2025 to Sep 2026 | Change |
|---|---|
| Keywords in positions 1 to 3 | +6% |
| Keywords in positions 4 to 10 | +9% |
| Keywords in positions 11 to 20 | −64% |
| Keywords in positions 21 to 50 | −99% |
| Keywords beyond position 50 | −100% |
Rankings on the first page improved. Everything deeper was switched off.
That exact shape repeats on Nike, Rebel Sport, The Iconic and Mecca, and all five land on precisely −100% beyond position 50. Not 97 percent, not 99.8 percent. Zero. Real search results do not behave that way. Reporting pipelines do.
It also explains the uniformity. A measurement change hits every site in a category at once, which is why all 21 running brands fell together, and why the error runs one way on 81 percent of sites. Dropping keywords can only subtract.
Search Engine Land reached the same conclusion from the other direction, finding that across 319 Search Console properties, 87.7 percent lost impressions and 77.6 percent lost unique ranking keywords in the weeks after the change.
What to do about it
Never report your own performance from a third-party traffic estimate. You have counted data for your own site. Third-party estimates exist for the case where you do not have access, which is competitors.
Re-check any 2026 decline against a source that counts. On 28 percent of these sites the direction was wrong. Cancelling a working strategy because of a modelled number is the expensive version of this mistake.
The distinction that matters is not first-party against third-party, it is counted against modelled. Anything that records a real event is usable:
- Google Search Console and Bing Webmaster Tools, which report clicks and impressions the search engines actually served
- GA4, Matomo, Fathom or Plausible, which record sessions that actually landed
- Shopify, BigCommerce or your platform's own analytics, which tie sessions to orders
- Server logs or Cloudflare analytics, the rawest version, every request as it happened
What they share is that a human or a bot did something and it was written down.
Ahrefs, Semrush, Similarweb, Moz and the rest do not work that way, and are not trying to. They estimate your traffic by scraping a sample of search results, working out where you rank, and multiplying by an assumed click-through rate for that position. That is a reasonable way to size up a competitor you have no access to. It was never a measurement of your own site, and this year is the clearest demonstration of the difference anyone is likely to get.
Report clicks, impressions and average position together. Most of these accounts look alarming on traffic alone and considerably healthier the moment position sits beside them.
Re-check conclusions drawn between October 2025 and now. That window contains a measurement change, so anything concluded across it deserves a second look, including the good news.
Keep using the tools for what they are still good at. Competitor movement, share of voice, backlinks, keyword discovery. None of those depend on a modelled traffic number being accurate to within 30 points.
The median site here really did lose a ninth of its clicks over the quarter, and that part is real. It is less than a third the size of the story the graphs have been telling, and on more than a quarter of sites it is the opposite one.
Do not panic, but do not stand still
If your third-party traffic graph fell off a cliff in late 2025, the most likely explanation is that your tool stopped counting, not that your customers stopped arriving. Check it against something that measures before you change anything.
It is tempting to file all this as a vendor problem, something Ahrefs will patch. That reading misses what the breakage is telling you.
A rank tracker rests on an assumption about search: that there is one ordered list of results, broadly the same for everyone, and that position 34 on that list is a stable enough coordinate to attach an expected click-through rate to. Fetching 100 results in a single request was cheap precisely because that list existed and could be read in bulk. The whole discipline of reporting on organic performance was built on top of that one assumption.
That assumption is the thing that is eroding, and the tooling is just the first place it became visible.
Look at which half of the data survived. Positions 1 to 10 held almost perfectly across every brand we checked. Everything past position 20 went to zero. Scraping economics explain why the tools stopped looking, but it is worth noticing what they stopped looking at: the deep tail is also the part of the results page that users had already stopped reaching. An answer now arrives above the organic results, so the scroll that used to carry someone to position 34 increasingly does not happen.
So the measurement did not only lose access to the data. It lost access to a concept that is itself getting thinner. If your visibility model is "rank at position N for keyword X", the instrument measuring that broke this year, and the thing it was measuring is further along the same path. A growing share of buying research now starts in ChatGPT, Gemini, Perplexity or Copilot and never reaches a results page at all, and there is no position to hold inside an answer. There is only whether you are in it.
That is the actual reason not to simply relax once you learn the decline was overstated. The number broke, and the model underneath the number is changing. Fixing the reporting is an afternoon of work. Moving your visibility to where the question now gets asked is the real job.
That means being the source an AI assistant can quote: clear entity and product information, structured data an assistant can parse, content that answers the question outright, and third-party coverage that teaches the models who you are. It means tracking brand mentions and citations in AI answers alongside your rankings, because that is the visibility layer that no longer shows up in a traffic estimate. And it means measuring the visit you do get on revenue per session, because a smaller, later, better-qualified visit is the shape of the next few years.
The brands that handle this badly will spend 2027 chasing a traffic number back to a level that was partly an artefact. The ones that handle it well will fix their reporting in an afternoon, then put the energy into being found where the question actually gets asked.
Method: Google Search Console properties under our management, pulled for July to September 2025 and July to September 2026. Properties were aggregated to one figure per business, preferring a domain property where one exists and otherwise summing distinct hosts, to avoid double counting. Sites with fewer than 900 clicks in the base quarter were excluded, as were any where the Search Console property showed a near-total loss that Ahrefs did not corroborate, which indicates a broken property and not a dead site. Ahrefs figures are organic traffic for the same domain, summed over the same three months, in subdomains mode with the country filter matching each site's primary market, pulled 13 October 2026. All client figures are anonymised at the brand level. Quarter is compared against the same quarter to remove seasonality, and October 2026 is excluded because the month was incomplete. The two publicly named retailers appear only in the keyword-position charts, which use public Ahrefs data.